Current research projects

Image Electrical components in refrigeration circuits
Image High temperature heat pump
Image Testing of mobile leak detectors according to DIN EN 14624
Image Measurements on ceiling mounted cooling systems
Image Solar Cooling
Image CO₂ GAS HYDRATES FOR SUSTAINABLE ENERGY AND COOLING SOLUTIONS
Image Electrochemical decontamination of electrically conducting surfaces „EDeKo II“
Image Modular storage system for solar cooling
Image Software for technical building equipment
Image Computational fluid dynamics CFD
Image Optimizing HVAC operation with machine learning
Image Heat2Power
Image Thermal engines
Image Innovative Parahydrogen Generator Based on Magnets
Image Test method for high - temperature heat pump - oils
Image Certifiable connection types in cryogenics

You are here:   /  Home


Hydrogen and methane testing field at the ILK

4517,224

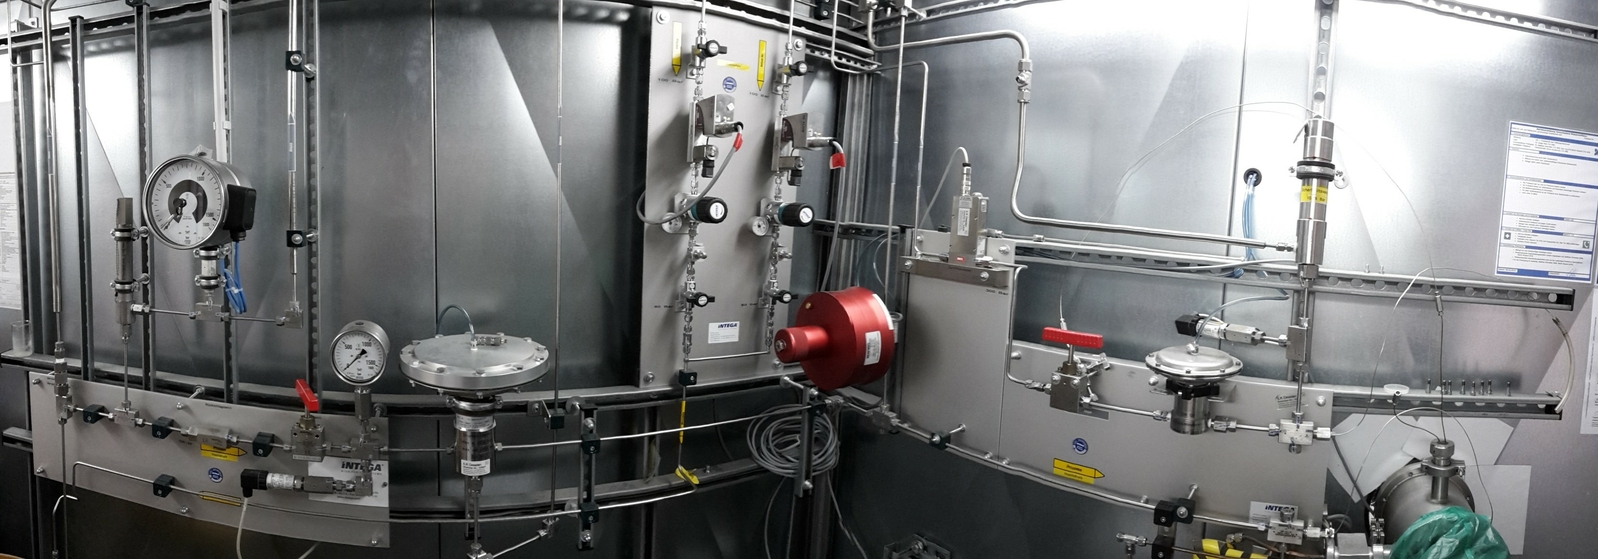
ILK Dresden operates an innovative testing ground for cryogenic high-pressure applications with hydrogen (H2), methane (CH4), and methane–hydrogen mixtures. With this, different services can be offered, among other things:

  • Test and qualification of components at temperatures ranging from 20 K (−253 °C) to room temperature and pressures ranging from high vacuum to 1000 bar (e.g. test of sealings, permeation tests).
  • Investigation of charge and discharge processes at cryogenic or room-temperature-operated storage systems for hydrogen and methane (e.g. adsorber storage systems, cryo-compressed hydrogen).
  • Investigation of catalyst materials for the ortho–para conversion of hydrogen.
  • Long-time thermal charging of components and materials in hydrogen or methane atmosphere at up to +200 °C and up to 160 bar for investigating degradation effects (e.g. hydrogen embrittlement).
  • Development of different hydrogen and methane components (e.g. recooling systems, latent-heat storage systems, cryogenic pressure storage systems, heat exchangers, cryogenic pumps).
  • Realisation of complete-system solutions for hydrogen and methane.

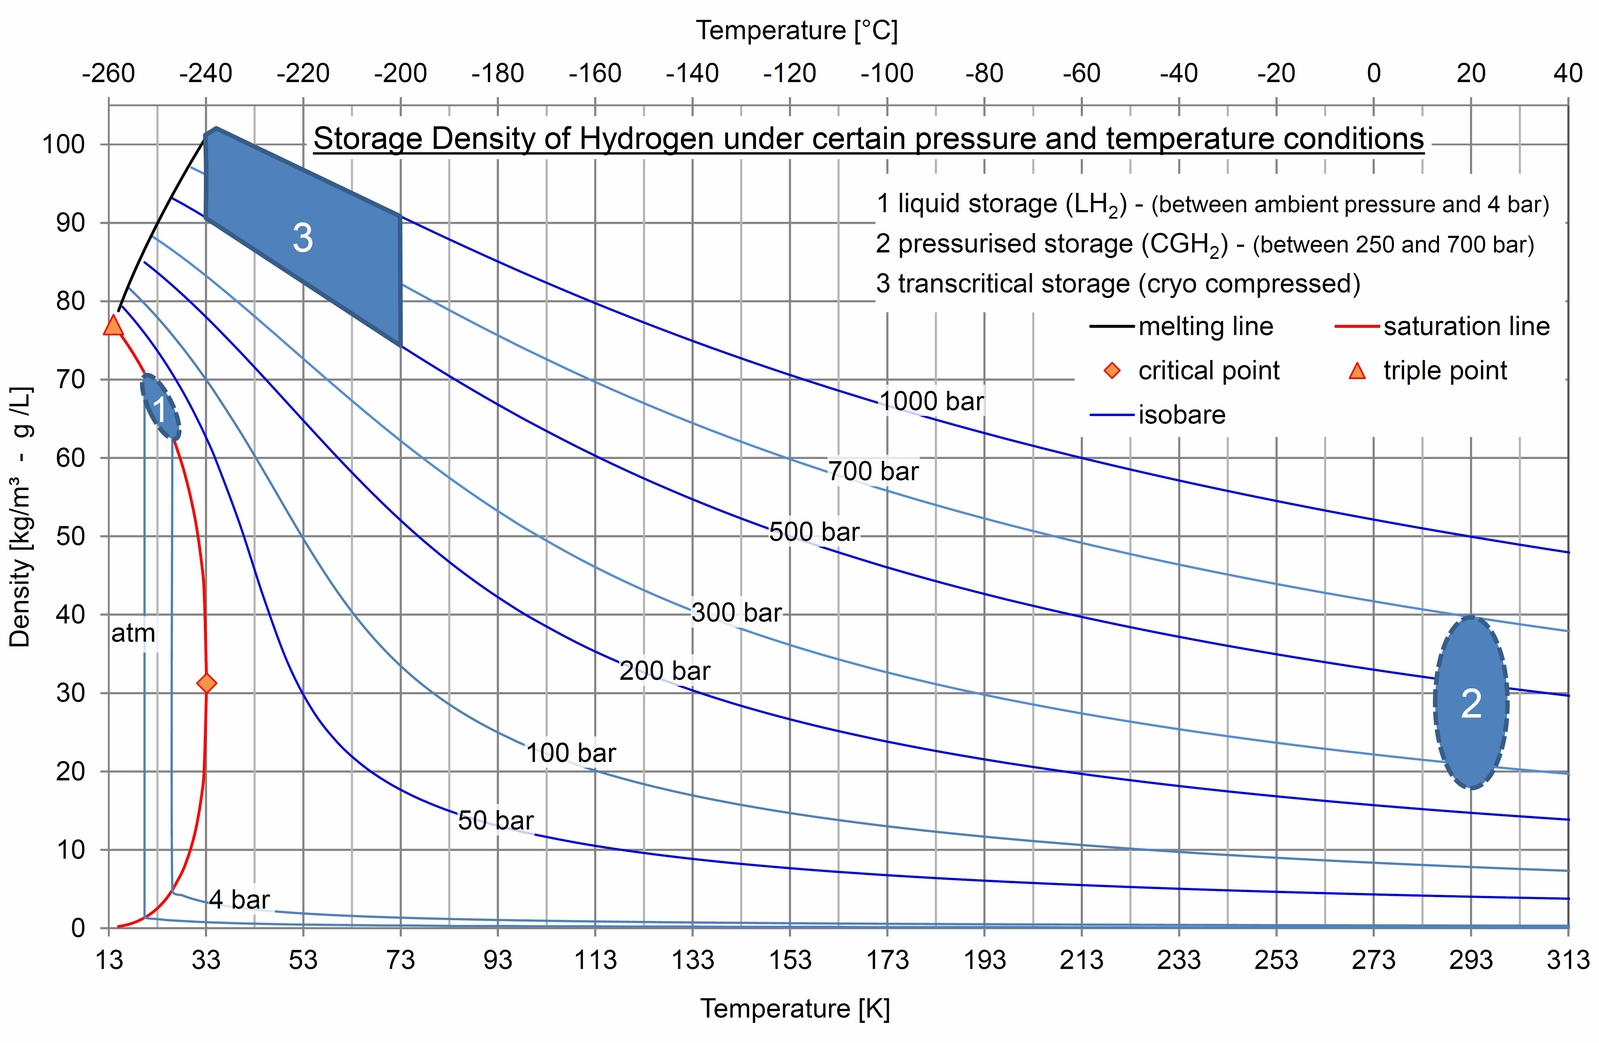
The following diagram depicts the specific storage density that can be achieved depending on temperature and pressure:

Your Request